
my colour short course is
now offered online through
Australia's National Art
School in Sydney! There's
a choice of two sessions to
suit every time zone. LINK
Home
The Dimensions of Colour
Basics of Light and Shade
Basics of Colour Vision
- Introduction
- Trichomacy and Opponency
- Adaptation and Successive Contrast
- Colour Constancy
- Simultaneous Contrast and Assimilation
Subtractive Mixing
Mixing of Paints
Hue
Lightness and Chroma
Brightness and Saturation
Principles of Colour
Afterthoughts
Glossary
References
Contact
Links
NEXT COLOUR
WORKSHOPS

TRICHROMACY AND OPPONENCY
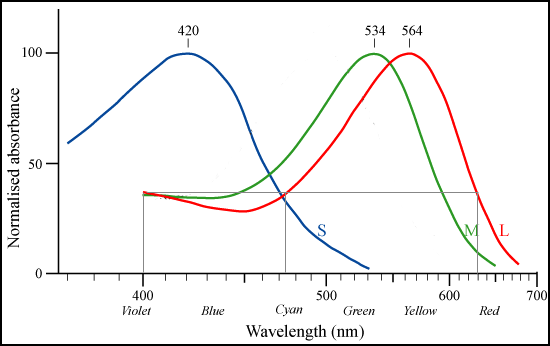
Figure 3.1. Normalized absorbance of the three human cone pigments, indicating the relative sensitivity of the three cone types to light of different wavelengths. Image source: Maxim Razin, after Bowmaker J.K. and Dartnall H.J.A., "Visual pigments of rods and cones in a human retina." J. Physiol. 298: pp501-511 (1980). http://commons.wikimedia.org/wiki/Image:Cone-response.png
Why three primary colours? The number three comes ultimately from the fact that our colour vision begins with three types of light-sensitive receptors, called cone cells, in the retina of the eye. The three cone types have broadly overlapping ranges of sensitivity, and are designated L, M and S (long, middle and short) according to the relative position of their peak sensitivities in the visible spectrum (Figure 3.1).
The idea of three receptor types was first proposed by Mikhail Lomonosov and George Palmer in the eighteenth century in connection with the then widely held belief that white light is a physically trichromatic mixture of red, yellow and blue rays. In its modern form the trichromatic theory stems from Thomas Young who, accepting the innumerable spectral gradations of Newton, argued that these must be detected by a finite number of receptor types, and suggested the number three corresponding initially to the three artist's primaries, and later to the red, green and violet spectral primaries from which all other spectral colours could be obtained by additive mixing. In the mid-nineteenth century Hermann von Helmholtz finally demolished the theory of physical trichromacy and, together with James Clerk Maxwell, revived and greatly developed Young's suggestion.
The L, M and S cones are sometimes described as red-, green-, and blue-sensitive respectively, but this is misleading on several levels. While the "blue-" and "green-sensitive" cones have their peak sensitivities in the violet-blue and green parts of the spectrum respectively, the so-called "red-sensitive" cones have their peak sensitivity in greenish-yellow, not red. More fundamentally, individual cone cell types do not "detect" colour, or even wavelength. The L and M cones are sensitive to all wavelengths of visible light, and while each responds to different parts of the spectrum to different degrees, their response does not in itself encode which part of the spectrum the stimulus came from. For example, an L cone responds in exactly the same way to light of wavelengths of 630 nm (red), 475 nm (cyan) and 400 nm (violet) (Figure 3.1). Only the balance of L, M and S responses to a monochromatic light serves to establish its position in the spectrum. The colour of a such a light is a mental perception created by our visual system based on post-receptoral comparison of the cone responses. For example, redness (in an isolated light) is a perception evoked by the predominance of the L and/or S cone response over the M response. Once we consider a field of view with several lights, or object colours, the relationship of L, M and S cone responses to perceived colour is no longer direct.
Thus while it might seem common sense to believe that redness, greenness and blueness are physical properties residing in different parts of the spectrum, and that cone cells "detect" these properties, this view is not compatible with the trichromatic theory of colour vision. Colour is a psychophysical property of lights and objects that exists only in relation to the visual system (just as sound is a psycholophysical property correlated with the physical property of frequency of vibration of air). For mixed lights, the same perceived colour can be evoked many physically different mixtures of wavelengths (called metamers) that have nothing in common except that they evoke the same balance of L, M, and S responses in the human visual system..
What we can say is that the three cone types effectively divide the visible spectrum into three bands - red-orange, green and blue-violet - in each of which the response of one cone type predominates over the other two (Figure 3.1). This three-fold division is visually evident in the spectrum (Figure 3.2), and was recorded in the rainbow in antiquity by Aristotle in his Meteorologica. The practical importance of these bands is that if we take three light sources, one from each band, we can make light mixtures with every possible combination of strong L, strong M and/or strong S signals, and thus make strongly coloured mixtures through the complete 360o range of possible hues. Three such lights thus make effective primaries for additive colour mixing.
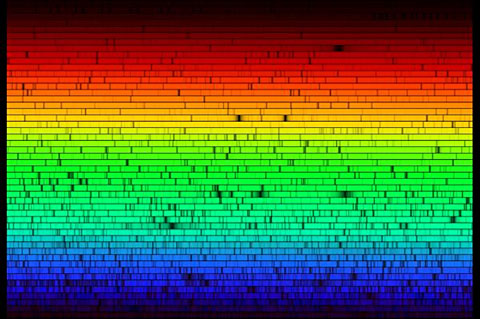
Figure 3.2. Solar spectrum. The orange-red, green and violet-blue
bands, in which the responses of the L, M and S cones respectively predominate
over the other two, are clearly evident on visual inspection of spectra such
as this complete solar spectrum. Image source: http://www.adlerplanetarium.org/cyberspace/sun/learning.html
(Credit: Nigel Sharp, NOAO/NSO/Kitt Peak FTS/ AURA/NSF).
While the three-receptor theory successfully explained additive colour mixing, it struck a problem in explaining our experience of colour. Young and Helmholtz assumed that the three receptors were responsible for "fundamental sensations" of red, green and violet, and that other colour sensations such as white and yellow were "mixed" sensations compounded from these. But as Ernst Mach and Ewald Hering soon pointed out, there are indeed unique hues in our psychological experience from which all others are compounded, but these hues are red, yellow, green and blue, not red, green and violet. These four hues are the only ones that we can experience as unique, that is, unmixed with other colours - all others seem to be mixtures of two unique hues. For example, we can experience or imagine a red that is neither orangeish or purplish, whereas all orange colours are both yellowish and reddish. In addition, these four colours are arrayed in pairs, such that no colour can be red and green, or yellow and blue, at the same time. Hering therefore rejected Helmholtz’s trichromatic theory, and proposed instead his opponent theory, in which receptors in the retina generate three opponent signals of red vs green, yellow vs blue and white vs black.
However the opponent theory was not so successful in explaining additive mixing: mixing unique red and green lights does not make white light, as Hering had assumed, but yellowish light; to make white light, either the red or the green must be somewhat bluish. Only yellow and blue are additive complementaries as well as opponent hues. It was realized early on that both Helmholtz and Hering could be essentially correct if they were describing different stages of the colour vision process, but most textbooks treated Hering's theory as a secondary alternative until the 1950's when Leo Hurvich and Dorothea Jameson devised a way of quantifying the red/green and yellow/blue components of the colours of the spectrum (Figure 3.3). Hurvich and Jameson proposed a two-stage zone model of colour vision, in which responses from Helmholtz’s three receptors are compared with each other to produce Hering’s three opponent signals. When studies of goldfish and primates soon discovered opponent cells whose signals were excited and inhibited by the responses of different cone types, it seemed that the mechanism for Hering’s opponent signals had been found, but these cone-opponent signals (L vs M and S vs (L+M)) turned out not to coincide with the colour-opponent hue signals of colour perception. Apparently therefore, the information encoded in the cone-opponent signals is reshaped at a (poorly understood) later stage into the red vs green and blue vs yellow colour-opponent signals. (This reshaping could well explain why additive complementary and opponent relationships differ for some hues). Multistage zone models like this had already been proposed in 1930-40, but had been widely ignored at the time because they seemed unnecessarily complicated.

Figure 3.3. Brightness ("achromatic"), y/b and r/g opponent signals for light throughout the spectrum. Hurvich and Jameson showed that by using a blue or yellow AND a red or green light they could match by hue cancellation all wavelengths of the visible spectrum, thus quantifying the r/g and y/b components of the colour sensation induced by each wavelength. Image source: http://webvision.med.utah.edu/imageswv/KallColor15.jpg
To see how the colours of the spectrum can be understood as different combinations of red vs green (r/g) and yellow vs blue (y/b) signals, drag the yellow triangular slider in Figure 3.4 to the left.. At the long-wavelength end, positive r/g and y/b signals occur, associated with high L, low M, and zero S responses (Figure 3.1), and we experience a broad zone of orange-red colours. Moving left towards shorter wavelengths, past where the L response peaks, r/g begins dropping, and at a wavelength around 577 nanometers passes through zero, and we experience unique yellow, that is, a yellow that is neither reddish nor greenish. (Note that we experience the unique hue, not where its hue signal is at its maximum, but where the other signal is at zero). To the left of this point negative r/g signals, broadly corresponding to a dominant M response, result in a series of greenish colours. At around 513 nm the y/b signal drops to zero, and we experience unique green, neither yellowish nor bluish. Throughout the remainder of the spectrum, where S is the dominant cone response (Fig. 3.1), the y/b signal is negative, and all of the colours are bluish in character. As the M response continues to fall compared to the S response, we reach a second point of zero r/g ( unique blue) at wavelengths around 475 nm, beyond which we get positive r/g signals and reddish colours (violet) again. All of the wavelengths quoted are subject to considerable individual variation.
Figure 3.4. Interactive demonstration of changing y/b and r/g signals throughout the spectrum. Push the slider from the long to the short wavelength end of the spectrum to understand how the colours of the spectrum result from different combinations of positive and negative r/g and y/b signals. Copyright David Briggs and Ray Kristanto, 2007.
Not all of the 360o range of possible hues can be evoked by single wavelengths of light. Unique red, for example, does not occur in the visible spectrum, because all long wavelengths evoke a positive y/b component. Colours from unique red through magenta to red-violet can only be evoked by a mixture of wavelengths from the red and blue/violet ends of the spectrum.
Revised 08 October 2011.