my colour short course is
now offered online through
Australia's National Art
School in Sydney! There's
a choice of two sessions to
suit every time zone. LINK
Home
The Dimensions of Colour
Basics of Light and Shade
Basics of Colour Vision
Additive Mixing
Subtractive Mixing
Mixing of Paints
Hue
Lightness and Chroma
Brightness and Saturation
- Brightness, Saturation and Colourfulness
- RGB, CMY and CMYK Colour Space
- HSB (=HSV) Colour Space
- HLS (=HSL) and HSI Colour Space
Afterthoughts
Glossary
References
Contact
Links
NEXT COLOUR
WORKSHOPS

BRIGHTNESS-BASED COLOUR SPACES 2: HSB (=HSV)
Although all screen colours can be produced by varying the R,G and B components, graphics programmes offer alternative means of adjusting these components that are intended to be more intuitive. HSB (=HSV), HSL (=HLS) and HSI are three such spaces devised for this purpose. All three are designed to resemble the system of hue, lightness and chroma familiar to artists, but all three lack a true lightness or chroma dimension. Of the three, HSL is perhaps the most intuitive for colour selection, but HSB is incomparably more powerful for applying the principles of colour, because its parameters named saturation (S) and brightness (B) relate closely to important parameters of colours seen as light. However both S and B have specific meanings in HSB that differ from absolute brightness and saturation, and relate instead to the range of possible values in RGB space. Both parameters are given on a scale of 1 to 100.
RELATIVE BRIGHTNESS (B)
The parameter called B or "Brightness" in particular means something quite different in HSB space to absolute brightness, and will be referred to here as relative brightness. B measures the brightness of a colour compared to the maximum possible for a colour of the same hue and saturation, which means having the same ratio of R/G/B. The numerical value of B is given by the brightness of the brightest RGB component as a percentage of 255. Thus all colours having at least one RGB component equal to 255 are said to have a brightness of 100. Such colours include white, all pure colours, and all tints (intermediates between white and a pure colour). These colours are the brightest possible version of their particular RGB ratio; they form the ceiling of hue-lightness-chroma colour solids such as CIE Lab or YCbCr (link). These colours range enormously in lightness, from L=100 for white down to a minimum of L = 30 for "Monitor Blue" (Figure 9.5).
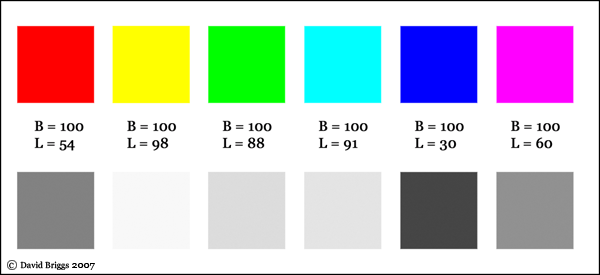
Figure 9.5. The top row of colours are all at maximum relative brightness (B=100), because in each case they are the brightest possible version of that pure colour. They vary greatly in lightness, however, as is confirmed by their measured greyscale value (L).
We might expect that for neutral colours the relative brightness of the light coming from an area of the screen surface, measured as a fraction of the maximum possible brightness for the device (R255 G255 B255), should be numerically equal to the perceived lightness of that surface, since this is also measured relative to maximum screen brightness. Measures of both lightness (L) and relative brightness (B) appear in the colour picker of Photoshop, and do move roughly in step with each other for neutral colours (Table 9.1). The numbers are not exactly equal, however, because of the different formulae used for the nonlinear transformation of each (see RGB Space).
B |
0 |
10 |
20 |
30 |
40 |
50 |
60 |
70 |
80 |
90 |
100 |
L |
0 |
9 |
22 |
33 |
43 |
53 |
63 |
73 |
82 |
91 |
100 |
Table 9.1. Comparison of relative brightness (B) and lightness (L) values from the Adobe Colour Picker for neutral colours between black (L=0) and white (L=100).
RELATIVE SATURATION (S)
In HSB space Saturation ("S") similarly refers to saturation compared to the maximum possible in RGB space. It is quantified by in effect considering a colour to be divided into a coloured component and a white component, and measures the proportion of the coloured component to the whole (Figure 9.4). Colours are at the maximum saturation (100) when one or two of the RGB values are zero. Fully saturated colours occupy the outward- and downward-facing planes of a colour space such as CIE Lab and YCbCr.
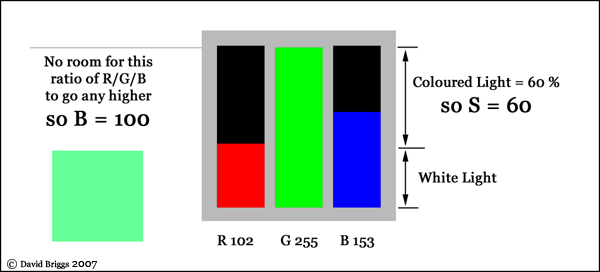
Figure 9.6. Calculation of Saturation (S) and Brightness (B) for the light green colour R 102 G 255 B153. The total amount of light may be thought of as being split into a white and a coloured component; S is the proportion of the coloured component of the total. Brightness (B) for this colour is 100, because it is the brightest possible colour with this ratio of R/G/B.
HSB space is conventionally visualized as an inverted cone or hexagonal pyramid, in which the vertical axis represents brightness, and the angle of divergence from the vertical axis represents saturation (Figure 9.7). Because the vertical axis is relative brightness, all of the pure colours, tints, and white appear at the same level, on the the top plane of the solid. If we transform the hexacone into a space where lightness is the vertical dimension. the pure colours take their places at their respective tonal levels, and we get a volume of a kind that we have already seen - in YCbCr. (A similar though slightly different solid would result if the vertical dimension was CIE lightness rather than Y or luma).
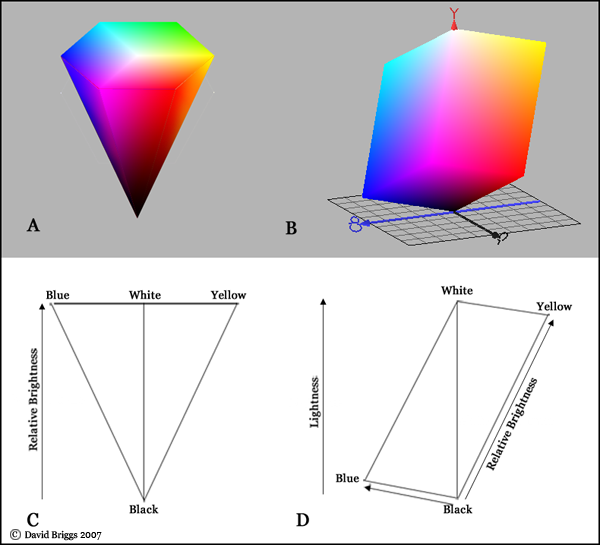
Figure 9.7. Relationship of HSB hexacone to the hue-lightness-chroma space YCbCr.
Figure 9.8 summarizes the conceptual relationship between relative brightness (B) and saturation (S) to lightness and chroma of a surface, for a single-hue triangle in a hue-chroma- lightness space. The colours F to Z show a range of intermediate tints between "Monitor Red" and White. All have maximum relative brightness (100), because all are the brightest possible version of that colour at that saturation. The measured lightness (L) however ranges from 54 for pure red to 100 (by definition) for white. The colours B to F have R = 51, 102, 153, 204 and 255 respectively; G and B = 0 in all cases. As light, these colours all have the same (maximum) saturation, because they are all pure red; in each case, only the red phosphors are glowing. As surfaces, they are not all equal in chroma however - F is the strongest colour, the one most different from grey.
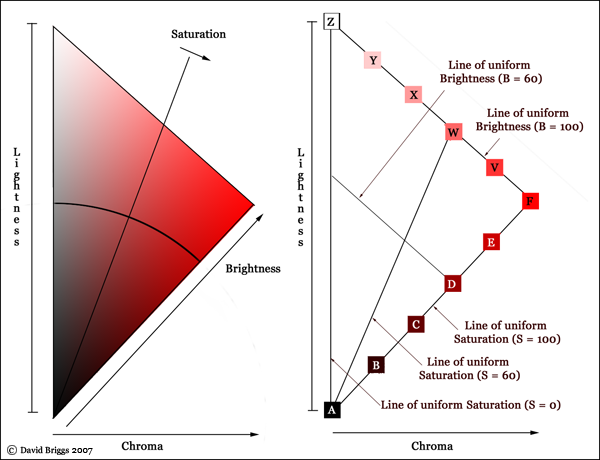
Figure 9.8. Left: Conceptual relationship of lightness, absolute brightness, relative brightness (B), chroma and saturation. Letters refer to colour series discussed below. Right all the possible variants of a single hue angle (H).
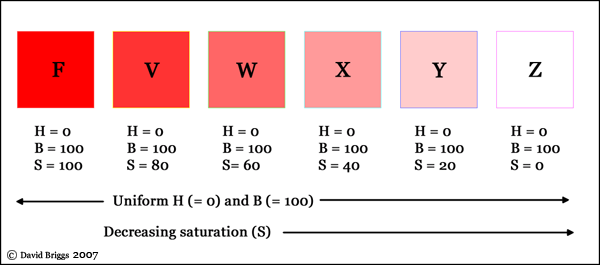
Figure 9.9 Intermediate tints between pure red and white. The colours are all at maximum relative brightness (B=100), because in each case they are the brightest possible version of red at that saturation. They progressively increase in lightness however from left to right.
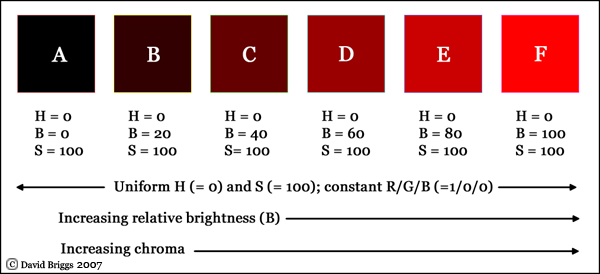
Figure 9.9. Intermediate shades between black and pure red. The colours are all at maximum saturation (S=100), because all are pure red. They progressively increase in relative brightness and chroma however from left to right.
Uniform saturation series such as B to F are of interest because within such a series, the brightness changes but the ratio of R to G to B components, and hence the balance of wavelengths, does not change. They therefore contain the set of colours that we need to represent a surface of a single colour under different amounts of illumination.
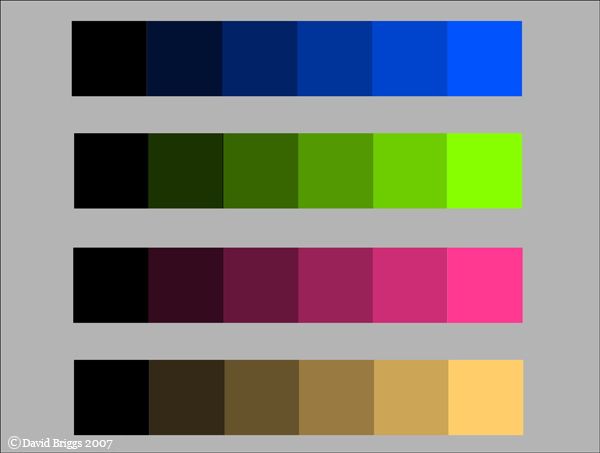
Figure 9.11. Four examples of uniform saturation (S) series.