
my colour short course is
now offered online through
Australia's National Art
School in Sydney! There's
a choice of two sessions to
suit every time zone. LINK
Home
The Dimensions of Colour
Basics of Light and Shade
Basics of Colour Vision
Additive Mixing
- Additive primaries
- Additive mixtures
- Additive complementaries
- Additive-averaging & pointllist mixing
- Object colours
Mixing of Paints
Hue
Lightness and Chroma
Brightness and Saturation
Principles of Colour
Afterthoughts
Glossary
References
Contact
Links
NEXT COLOUR
WORKSHOPS

4.2 ADDITIVE MIXTURES
Let's now look in detail at the process of additive mixing on a computer monitor (Fig. 4.2.1).
Figure 4.2.1. Interactive demonstration of additive mixing of RGB screen colours. Sliders control the brightnesses of the R (top), G(middle) and B (bottom) screen phosphors on a perceptual (nonlinear) scale, like the RGB values seen in Photoshop. Copyright David Briggs and Ray Kristanto, 2007.
With all three lights at maximum intensity the result is white light. This means that in terms of our opponent processing, the redness vs greenness (r/g) and yellowness vs blueness (y/b) opponent signals are both zero. Additionally, in terms of our lightness perception, the screen is seen as having a greyscale value of absolute white, because based on the complete array of colours seen, we judge the brightness of the result to be the maximum possible. With all three RGB lights at 50% on their (perceptual) brightness scales, the light coming from the screen is still white, but the screen is seen as middle grey.
Whenever the RGB primaries are unequal in brightness, however, the r/g and/or y/b signals are unbalanced, and the screen appears coloured. The most saturated coloured mixtures are obtained by combining the red (R), green (G) and blue (B) primaries two at a time, and having the third primary at zero. When R and G are both at their full intensity with B on zero, we see the result as bright yellow. Reducing one or other component shifts the yellow towards red and green respectively. The mixing of red and green light is surprising visually because it involves generation of a strong yellow signal (strongly positive y/b) only subtly evident in the components, and cancellation of their conspicuous r and g signals. (It is additionally unexpected to anyone used to the results of mixing paints). Less surprisingly, mixing the B and G lights in various proportions creates a continuous range of visually intermediate hues with generally negative y/b and negative r/g, passing through a blue-green colour called cyan, while R and B in various proportions generate a range of hues of negative y/b and positive r/g, passing through the red-violet colour we call magenta. Together these pair-wise combinations of primaries span the entire hue circle (Fig. 4.2.2). "Monitor" yellow, magenta and cyan are all lighter than the primaries forming them, for the obvious reason that they are additive mixtures of both of those primaries.
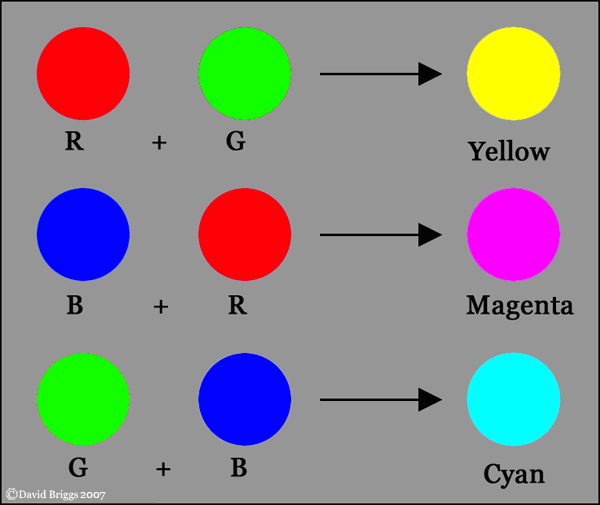
Figure 4.2.2. Additive mixing of RGB colours.
Less saturated (more whitish) colours are produced by adding the third primary. You will see that the position of the slider for the third primary in effect controls the proportion of white light (left from the slider) to coloured light (right from the slider) in the mixture. The parameter of saturation (S) in HSB space is a measure of the coloured component of an RGB colour, and increases as the smallest of the three RGB components decreases.
Keeping the ratio of R/G/B constant while varying the absolute brightnesses generates a series of mixtures of uniform hue and saturation. The maximum brightness of this series is reached when one of the RGB components reaches 100%, because no greater brightness is possible without changing the R/G/B ratio. The position of the slider for the highest primary in effect determines the proportion of black (right from the slider) in the colour. The parameter of brightness (B) in HSB space a measure of the brightness of an RGB colour relative to the maximum possible at that hue and saturation, and increases as the largest RGB component increases.
Mixing of projected light beams (Fig. 4.2.3) is another example of additive mixing, and produces the same results as we saw with on-screen additive mixing, with one important exception: the mixtures are seen as light rather than object colours, and so the less bright mixtures are seen as dimmer light instead of greyed object colours. (You will however see greyed colours if you look at Figure 4.2.3 as a 2D image instead of a 3D scene, and concentrate on the image colours present).
Figure 4.2.3: Interactive demonstration of additive mixing of spotlights. Top, middle and bottom sliders control the brightnesses of the red, green and blue spotlights respectively. Copyright David Briggs and Ray Kristanto, 2007.
Looking back to Figure 4.1.2 you will see that the light from the screen that we experience as white has a spectrum made up of uneven spikes. This is possible because these spikes are distributed through the red, green and blue-violet bands of the spectrum in such a way as to cancel each other out, producing r/g and y/b opponent signals that are both zero. This will also occur if all wavelengths of the spectrum are represented in equal energy, as is approximately the case with daylight, and also occurs with the even spikier spectral distributions of fluorescent lighting, as long as the inputs from the three bands of the spectrum balance out. The phenomenon of different spectral distributions looking identical in colour, i.e. being indistinguishable to our visual system, is called metamerism. Metameric differences in the spectra of similar-looking light sources can cause potentially serious annoyance for painters, in that they can cause substantial shifts in tonal and colour relationships within a painting.